How to order your study topics

Perhaps this is an unorthodox and unscientific way to use gplot function, but I think, this kind of application might be helpful, if you have some kind of chaos in your mind whenyou order your study ;-)Publish
1) First I made a list of the main and subtopics of my study.
2) Then, I constructed a symmetric matrix using my topics as row and col names, and
3) after that I intuitively estimated, how much these topics "intersect" each other [I used fuzzy values between 0-1],
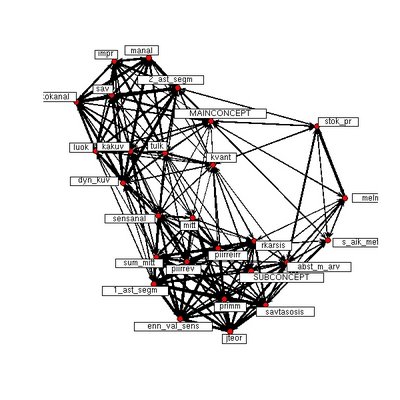
4) and then I (or better, R !) made a weighted association map.
(This is the first version of the map... there are still too many futile links between topics.)
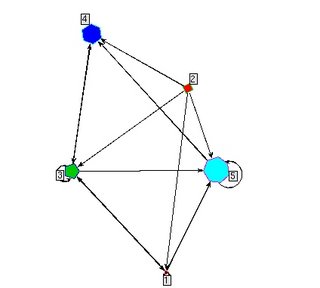
You can found later version here.


